|
GOVERNMENT EXHIBIT P2290
Please see the important disclosures at the end of this report.
MorganStanley
Equity Research
North America |
|
United States of America
Enterprise Software |
|
PeopleSoft
Reuters: PSFT.O Bloomberg: PSFT NASDAQ: PSFT |
Charles E. Phillips
+ 1 (1)212 761 4450
Charles.Phillips@morganstanley.com
Evan Bloomberg
+1 (1)212 761 3659
Evan.Bloomberg@morganstanley.com |
|
| Change in Earnings Forecast |
|
April 26,2002
|
| STOCK RATING EQUAL-WEIGHT-V |
Price (April 26, 2002) $21.89
Price Target NA
52-Week Range $51 - 15.78 |
| Stock ratings are relative to the analysis industry (or industry team's) coverage universe |
| MSCI SECTOR INFORMATION TECHNOLOGY |
US Strategist Weight 14%
S&P 500 Weight " 15% |
| |
| WHAT'S CHANGED |
Earnings (2002) $0.68 to $0.56
Earnings (2003) $0.78 to $0.68 |
|
|
At the Ready for a Tough Journey Ahead
- Guidance Lowered; Less Detail
The company gave similar guidance as Siebel, which is flat sequentially with the possibility of better or worse results depending on the economy, and no guidance for the second half of the year.
- Still Good Relative Performance
The year over year decline of 13% in license revenue was still better than most of its competitors including Siebel, Oracle, and JD Edwards and roughly in line with SAP's decline.
- Near Term Outlook
We expect the stock to trade between a 29-3 lx multiple off consensus estimates for next year which we expect to fall in the $0.65 to $0.75 range. Those numbers suggest a trading range of $19 to $23 in the near term.
- Industry view is In-Line
Our thesis of an improving macroeconomic environment leading to an eventual upturn in capital spending results in our In-Line view of the Enterprise Software industry. We believe the worst is over, as 2002 should be a year of gradual and modest improvement, with further improvement in 2003, but overall tech spending should lag the pace of the recovery because of the lingering effects of over buying in the past.
|
|
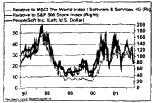
Stock Price Performance
|
|
| FY ending Dec 31: |
2001A |
2002 E |
2003 E |
2004E |
| EPS ($) |
0.58 |
0.56 |
0.68 |
|
| Prior EPS Ests. ($) |
_ |
0.68 |
0.78 |
_ |
| Revenue($ m) |
2,119 |
1.924 |
2.114 |
- |
| P/E |
37.7 |
39.1 |
32.2 |
_ |
| Price/Revenue |
34 |
3.7 |
3.4 |
|
| Market Cap ($ m) |
7.133 |
| Q'rtly EPS |
2001A actual |
2002E curr prior |
2003E curt prior |
| Q1 |
0.11 |
0.14A |
0 15 0.16 |
| Q2 |
0.14 |
0 13E 0.16E |
0 15 0.18 |
| Q3 |
0 15 |
0.13E 0.19E |
0 17 0.21 |
| CM |
0.18 |
0.16E 0.19E |
0.21 0.23 |
|
| L-T EPS Grth ('yy- 'yy) (%) |
20.0 |
| P/E to Growth |
1 95 |
| Shares Outstanding (m) |
325.9 |
|
|
Company Description
PeopleSoft designs, develops, markets, and supports a family of enterprise internet application software products for use in organizations worldwide, higher education institutions, and federal, state, provincial, and government agencies.
|
|
E - Morgan Stanley Research Estimate |
MS 00912
At the Ready for a Tough Journey Ahead
|
Summary and Investment Conclusion
PeopleSoft reported its final earnings results on April 25, 2002 after preannouncing earlier in the month. The quarterly results were in-line with the pre-announcement but below our original revenue forecast. Earnings were in line with consensus as the company managed to rein in spending to offset the top line weakness
Guidance Lowered; Less Detail
The company gave similar guidance as Siebel, which is flat sequentially with the possibility of better or worse results depending on the economy, and no guidance for the second half of the year. Given the uncertainty about the spending environment and the unpredictability of close rates, PeopleSoft as well as many other companies are choosing to get out of the forecasting business. We can sympathize with the difficulty of forecasting a volatile industry in a volatile macro environment and didn't expect much detailed guidance. The company's Q2 guidance assumes the abnormally low close rates of Ql continue.
The slock will likely weaken in the near term and then we'll quickly be back to a macro call on the economy and IT spending. By our estimates, companies only spent 11% of their 2002 IT budget budgets in Ql. The sluggish start to the year could be just that as companies recover from a tumultuous year in 2001. After stepping on the brakes all last year, ClOs were unlikely to jam on the accelerator right out of the gate in Ql.
PeopleSoft's performance should be viewed in context with the rest of the group. The year over year decline of 13% in license revenue was still better than most of its competitors including Siebel, Oracle, and JD Edwards and roughly in line with SAP's decline. The company isn't as good as Siebel is painting a good picture on its performance, no matter what's reported, but the absolute growth rates speak for themselves. Siebel did better on a sequential basis in Ql but that's partly because last year was so much worse for Siebel and it rolled over a third of the quarter in the form of backlog from Q4.
PeopleSoft's balance sheet remains strong with DSO of 58 days and $ 1.8 billion in cash. The company was solidly profitable and generated cash from operations.
|
|
But PeopleSoft's exceptional performance in 2001 makes for tough comparisons this year, although to be fair comparisons weren't easy last year either.
Quick View of the Quarter
- Total revenues of $483.3 million versus our original estimate of $503.4 million and our most recent estimate of $480 million, a 9% decrease sequentially and 4% decrease Y/Y.
- License revenues of $133.3 million, versus our original estimate of $ 160 million and our most recent estimate of $130 million -- a sequential decrease of 23% and a 13% decrease Y/Y.
- Services revenue was $25.5 million -- a sequential increase of 2% and a 7% increase Y/Y.
- DSO was 58 versus 64 days last quarter.
- Deferred revenue on the balance sheet was $421 million, up from $409 million from the previous quarter.
- The company added 78 new customers for the quarter and had 25 deals over $ 1 million, with one deal in the $10 million to $20 million range.
- Revenue from new customers was weaker than previous quarters at 25%, and was a significant contributor to the shortfall.
- Average deal size was $600,000, compared to $700,000 in 4Q01.
- International and North America grew at the same rate this quarter.
|
MS 00913
|
Key Highlights
How Does It Change Our View?
- Rating: Reiterate our Equal-weight- V rating.
- Lowering Estimates: In 2002, we are lowering our total revenue and earnings estimates from $2,076 million and $0.68 to $1,924 million and $0.56, respectively. In 2003, were are lowering our total revenue and earnings estimates from $2,374 million and $0.78 to $2,114 million and $0.68, respectively.
Catalysts
- An improvement in predictability of close rates, and then actual close rates are key catalyst for the stock.
What Looked Good
- Relative Performance: Despite the fact that the company came in below expectations, the license revenue growth was still belter than many of the largest enterprise software companies such as Oracle, Siebel, JD Edwards, and i2.
- Upgrade Cycle Not the Issue In the Quarter: The weakness in the quarter was derived from a lower than expected license revenue figure from new customers, while license revenue from existing customers tracked to plan.
Red Flags in the Quarter
- License Revenue Below Initial Expectations: The company reported license revenue that was $32 million below analyst's original estimates.
- Close Rates and ASP were Down: Sequentially, close rates were down this quarter. Going into 2Q02, close rate predictability remains low. Average deal size in the quarter came down from $700,000 to $600,000.
What Was Reported
- License Revenue: $133 versus our estimate of $130 million and the preannounced result of $130 million to $135 million.
- EPS: $0.14, which was in-line with our initial estimate and the preannounced estimate.
|
|
Outlook
We expect the shares to trade at around a 40% discount to Siebel as it has for the last couple of years. That would suggest a 29-3 1x multiple off consensus estimates for next year which we expect to fall in the $0.65 to $0.75 range. Those numbers suggest a trading range of $19 to $23 in the near term.
However, we believe PeopleSoft's competitive position still remains quite solid. The upgrade cycle remained intact since it was sales to new customers starting new projects that fell off in the quarter. New customers fell to 25% of revenue from 39% last quarter. That's consistent with a Ql hesitation in the market since new projects tend to get more scrutinized more closely than upgrades and extensions of existing infrastructure. Support for version PeopleSoft 7.5 will end in 12 months at which point PeopleSoft customers will need to either upgrade to PeopleSoft 8 or remain on PeopleSoft 7.5 without support. Consequently we expect the upgrade cycle to continue and new customers will come back when the economy strengthens.
Stepping back a bit, the back-office applications market for global companies is dominated by an oligopoly comprised of SAP, PeopleSoft, and Oracle. The market is down to three viable suppliers who will help re-automate the back-office business processes for global enterprises for years to come. These are critical functions and while most companies have begun implementing these products, few have completely rolled out a suite across all locations and countries on the latest version of the technology. At some point the pressure to open up the back-office to customers and supplier for machine to machine communications via web services will encourage more companies to modernize their back-office infrastructure most consistently. PeopleSoft had made it into an elite club of critical enterprise software suppliers - those with thousands of customers relying on the company for mission critical functions.
We're watching corporate profits outside of the technology and telecom sectors as a catalyst and we see saw some encouraging signs in Ql. Two thirds of the non-technology companies reporting in Q1 met or beat estimates. But the data is preliminary and the turnaround still fragile. But the prospect of improved corporate earnings logically leads to a possibility of improved technology spending later this year.
|
MS 00914
| Exhibit 1 |
|
PeopleSoft First Quarter 2002 Financial Results
|
| $Million (EPSS) |
MS 1Q02
Estimate |
1Q02
Actual |
4Q01
Actual |
1Q01
Actual |
| |
|
|
|
|
| % Growth (Y/Y) |
4.4% |
-13.0% |
5.8% |
69.9% |
| % Growth (Q/Q) |
-8.1% |
-23.4% |
14.7% |
-6.8% |
| |
|
|
|
|
| % Growth (Y/Y) |
51% |
7.3% |
11.6% |
21.8% |
| % Growth (Q/Q) |
0.0% |
2.1% |
0.6% |
6.2% |
| |
|
|
|
|
| % Growth (Y/Y) |
0.1% |
-3.9% |
6.1% |
34.0% |
| % Growth (Q/Q) |
-4.7% |
-8.5% |
3.7% |
1.1% |
| |
|
|
|
|
| Operating Margin |
13.1% |
13.1% |
15.2% |
9.2% |
| Tax Rate |
34.5% |
34.5% |
34.5% |
34.5% |
| |
|
|
|
|
| Shares Outstanding |
326 |
326 |
323 |
315 |
| DSO |
- |
58 |
64 |
77 |
| |
|
|
|
|
Source: Company data. Morgan Stanley Equity Research estimates
Estimates are based on our figures prior to the company's preannouncement.
|
Company Guidance
The company described the IT spending environment as very cautious and made the caveat that predicting future financial results is very difficult in this environment. As a result, the company expects demand in the information technology market to be flat next quarter. Management did highlight the potential for a pickup in demand during the 2H02. The current assumption on close rates is that they will remain flat at current levels, which were down in 1Q02. This guidance implies flat license revenue and flat earnings per share in 2Q02 of $133 million and $0.14, respectively.
The company will also have a non-recurring write off in 2Q02 of $ 10 million for in process research and development as a result of the purchase of Momentum. In addition, the purchase price of Momentum, less $10 million will be allocated to capitalize software and amortized over five years.
|
|
Income Statement Summary
Earnings per share were in-line with expectations. The company reported $0.14, which compares to our estimate of $0.14 and preannounced estimate of $0.14.
Revenue for the quarter on an absolute basis was $483.3 million, year over year growth was -4% and sequential revenue growth was -9%. License revenue for the quarter on an absolute basis was $133.3 million, year over year growth was -13% and sequential revenue growth was -23%. Services revenue for the quarter on an absolute basis was $342 4 million, year over year growth was 7% and sequential revenue growth was 2%. The company did reclassify out of pocket expenses in accordance with FASB.
Operating margins for the quarter were 13%, which compares to 15% last quarter and 9% in the year ago period. The company was able to improve both services margins and general and administrative expenses in order to manage toward the bottom line result and hold operating margins at a very respectable 13%.
In 1Q02, service margins were 52% and license margins were 91%. Service margins were 47% last quarter and 44% in the same period last year. License margins were 92% last quarter and 89% in the same period last year. Sales and marketing was 26% of revenue, which compares to 24% last quarter and 25% in the year-ago period. Research and
|
MS 00915
| development was 17% of revenue which compares to 14% last quarter and ]5% in the year ago period (excludes Development Services Costs). General and administrative expense was 6% of revenue, which compares to 7% last quarter and 7% in the year ago period.
Balance Sheet and Cash Flow Summary
The company finished the quarter with $1,823 million in total cash, which compares to $1,673 million last quarter and $1,155 million one year ago. DSO for the company was down sequentially to 58 days, which compares to 63 days last quarter and 75 days in the same period one year ago. Deferred revenue was up sequentially to $421 million, which compares to $409 million last quarter and $415 million last year. The increase in deferred revenue is largely a result of strong first quarter maintenance renewals. Cash flow from operations was $141 million this quarter.
Customer Metrics
PeopleSoft brought in 78 new customers in the quarter, down from 147 last quarter. New customer license revenue was 25% of total license revenue, which compares a recent quarterly average of 39%.
PeopleSoft's ASP was $600,000 this quarter, which compares to $700,000 last quarter and a historical level of $500,000. There were 25 deals in the quarter that were greater than $1 million, which compares to 41 from last quarter. Additionally, PeopleSoft had one deal in the $10 to
|
|
$20 million range. This deal was a human capita] management sale, which was global in nature.
Thus far, 1/3 of PeopleSoft customers have upgraded to PeopleSoft 8, the remaining 2/3 have not upgraded. Support for version PeopleSoft 7.5 will end in 12 months at which point PeopleSoft customers will need to either upgrade to PeopleSoft 8 or remain on PeopleSoft 7.5 without support.
Revenue Segmentation Analysis
By Product-- Across product lines, the company saw consistent relative performance.
By Geography-- North America and International license revenue both decreased year over year at comparable rates of 13%. On a constant currency basis, International was down 8% year over year.
By Verticals -- One market that performed better than the bunch was education and government. This was the company's least impacted sector in the quarter.
Headcount
The company decreased headcount sequentially from 8,436 last quarter to 8,512 this quarter. The decrease in headcount is attributed to a decrease in services.
|
MS 00916
| Exhibit 2 |
PeopleSoft
Sales and Earnings Summary |
| ($ Millions Except Per-Share Data) |
2001 |
2002E |
2003E |
| |
3/01
|
6/01
|
9/01
|
12/01
|
CY01
|
3/02
|
6/02E
|
9/02E
|
12/02E
|
CY02E
|
3/03E
|
6/03E
|
9/03E
|
12/03E
|
CY03E
|
| North American Revenue |
391 4
|
407.9
|
392.7
|
402.0
|
1594.0
|
367.3
|
355.7
|
359.5
|
384.6
|
1467.1
|
375.7
|
380.3
|
392.9
|
425.6
|
1574.4
|
| International Revenue |
122 7
|
136.6
|
128.1
|
137.6
|
525.0
|
116.0
|
106.3
|
113.5
|
121.4
|
457.2
|
125.2
|
126.8
|
138.0
|
149.5
|
539.6
|
| Total License fees |
1S3 3
|
166.3
|
151.8
|
174.1
|
645.4
|
133.3
|
120.0
|
128.0
|
151.0
|
532.3
|
135.9
|
132.0
|
145.9
|
175.2
|
589.0
|
| y/y % change |
70%
|
51%
|
15%
|
6%
|
30%
|
-13%
|
-28%
|
-16%
|
- 13%
|
- 18%
|
2%
|
10%
|
14%
|
16%
|
11%
|
| seq % Changes |
-7%
|
8%
|
-9%
|
15%
|
-
|
-23%
|
-10%
|
7%
|
18%
|
-
|
-10%
|
-3%
|
11%
|
20%
|
-
|
| Services |
330.2
|
34.9
|
344.8
|
346.9
|
1371.0
|
342.4
|
342.0
|
345.0
|
355.0
|
1364.4
|
365.0
|
375.0
|
385.0
|
400.0
|
1525.0
|
| y/y % change |
22%
|
20%
|
22%
|
12%
|
19%
|
4%
|
-2%
|
0%
|
2%
|
1%
|
7%
|
10%
|
12%
|
13%
|
10%
|
| Development Services |
30.7
|
29.2
|
24.1
|
18.7
|
102.7
|
7.5
|
0.0
|
0.0
|
00
|
7.5
|
0.0
|
0.0
|
0.0
|
0.0
|
0.0
|
| y/y % change |
33%
|
-7%
|
-35%
|
-43%
|
-16%
|
-75%
|
-
|
-
|
-
|
-93%
|
-
|
-
|
-
|
-
|
-
|
| Total Revenues |
514.2
|
544.5
|
520.7
|
539.7
|
2119.1
|
483.3
|
462.0
|
473.0
|
506.0
|
1924.3
|
500.9
|
507.0
|
530.9
|
575.2
|
2114.0
|
| y/y % change |
34%
|
27%
|
15%
|
6%
|
20%
|
-6%
|
-15%
|
-9%
|
-6%
|
-9%
|
4%
|
10%
|
12*%
|
14%
|
10%
|
| seq % Change |
1%
|
6%
|
-4%
|
4%
|
-
|
-10%
|
-4%
|
2%
|
7%
|
-
|
-7%
|
1%
|
5%
|
8%
|
-
|
| Cost of Licenses |
16.3
|
18.2
|
12.0
|
14.8
|
61.3
|
11.4
|
10.2
|
10.9
|
12.8
|
45.4
|
10.9
|
10.6
|
11.7
|
14.0
|
47.1
|
| Cost of Services |
184.8
|
196.0
|
180.5
|
183.0
|
744.2
|
164.5
|
164.2
|
164.9
|
169.7
|
663.3
|
171.6
|
176.3
|
181.0
|
188.0
|
716.8
|
| Cost of Development Services |
27.9
|
26.5
|
21.8
|
16.9
|
93.1
|
6.8
|
0.0
|
0.0
|
0.0
|
6.8
|
0.0
|
0.0
|
0.0
|
0.0
|
0.0
|
| Total Cost of Revenue |
228.9
|
240.7
|
214.4
|
214.7
|
898.6
|
182.7
|
174.4
|
175.8
|
182.5
|
715.4
|
182.4
|
186.8
|
192.6
|
202.0
|
763.9
|
| Salea & Marketing |
126.2
|
137.4
|
126.0
|
130.3
|
513.9
|
124.6
|
119.2
|
120.1
|
125.0
|
483.9
|
125.2
|
125.7
|
129.0
|
138 0
|
518.0
|
| Product Development |
79.0
|
73.8
|
70.9
|
75.2
|
299.0
|
82.3
|
87.6
|
88.5
|
93.6
|
352.2
|
95.2
|
93.6
|
96.6
|
101.6
|
387.4
|
| General & Administrative |
33.9
|
41.7
|
40.9
|
39.1
|
155.6
|
30.2
|
30.0
|
30.0
|
31.0
|
121.2
|
31.0
|
32.0
|
33.0
|
34.0
|
130.0
|
| Other Changes |
-
|
-0.7
|
0.8
|
-
|
0.0
|
2.8
|
10.0
|
4.0
|
4.0
|
20.8
|
4.0
|
4.0
|
4.0
|
4.0
|
16.0
|
| Total Expenses |
239.1
|
246.2
|
238.6
|
244.6
|
968.5
|
239.9
|
247.0
|
242.6
|
253.6
|
983.1
|
255.4
|
255.5
|
262.6
|
277.1
|
1051.4
|
| Operating Income Reported |
46.1
|
57.7
|
6.77
|
80.4
|
252.0
|
60. 6
|
40.7
|
54.6
|
69 9
|
225.8
|
67.1
|
64.1
|
75.7
|
95.3
|
298.7
|
| Operating Margin - Reported |
9.0%
|
10.6%
|
13.0%
|
14.9
|
11.9%
|
12.5%
|
8.8%
|
11.5%
|
13.8%
|
11.7%
|
13.4%
|
13.5%
|
14.7%
|
17.3%
|
14.9%
|
| Operating Income - Normalized |
46.1
|
57.0
|
68.5
|
80.4
|
252.0
|
63.4
|
50.7
|
58.6
|
73.9
|
246. 6
|
67.1
|
68.7
|
79.7
|
99.3
|
314.7
|
| Operating Margin - Normalized |
9.0%
|
10.5
|
13.2%
|
14.9%
|
11.9%
|
13.1%
|
11.0%
|
12.4%
|
14.6%
|
12.6%
|
13.4%
|
13.5%
|
15.0%
|
17.3%
|
14.9%
|
| Other - Reported |
8.9
|
13.1
|
7.8
|
7.8
|
37. 6
|
7.2
|
7.5
|
7.5
|
8.0
|
30.2
|
8.0
|
8.5
|
8.5
|
8.5
|
33.5
|
| Other - Normalized |
-
|
-
|
-
|
-
|
0.0
|
-
|
-
|
-
|
-
|
0.0
|
-
|
-
|
-
|
-
|
0.0
|
| Pratax Income - Reported |
55.1
|
70.8
|
75.5
|
88.2
|
289.6
|
67.8
|
48.2
|
62.1
|
77.9
|
256.0
|
71.1
|
73.2
|
84.2
|
103.8
|
332.2
|
| Pretax Income - Normalized |
55.1
|
70.1
|
76.2
|
88.2
|
289.6
|
70.6
|
58.2
|
66.1
|
81.9
|
276.8
|
75.1
|
77.2
|
88.2
|
107.8
|
348.7
|
| Taxes Reported |
19.0
|
23.5
|
25.7
|
30.4
|
98.0
|
23.3
|
16.6
|
21.4
|
26.9
|
88.2
|
24.5
|
25.2
|
29.0
|
35.8
|
114.6
|
| Taxes - Normalized |
19.0
|
24.5
|
26.7
|
30.4
|
100.6
|
24.4
|
16.6
|
21.4
|
26.9
|
89.3
|
24.5
|
25.2
|
29.0
|
35.8
|
114.6
|
| Tax Rate Normalized |
35%
|
35%
|
35%
|
34%
|
35%
|
35%
|
29%
|
32%
|
33%
|
32%
|
33%
|
33%
|
33%
|
33%
|
33%
|
| Net Income - Reported |
36.1
|
47.4
|
50.3
|
57.8
|
191.6
|
44.5
|
31.5
|
40.7
|
51.0
|
167.8
|
46.6
|
47.9
|
55.1
|
68.0
|
217.6
|
| Net Incomes Normalized |
36.1
|
45.6
|
49.6
|
57.8
|
188.9
|
46.3
|
41.5
|
44.7
|
55.0
|
187.5
|
50.6
|
51.9
|
59.1
|
72.0
|
233.6
|
| Basic Avg [Unreadable text] |
290.2
|
296.1
|
302.2
|
303.7
|
298.0
|
308.0
|
311.1
|
314.2
|
317. 3
|
312.6
|
320.5
|
323.7
|
326.9
|
330.2
|
325.3
|
| FD Avg Shrs (mil ) |
315.0
|
318.6
|
322.3
|
323.7
|
319.8
|
325. 9
|
329.1
|
33.24
|
335.7
|
330.8
|
339.1
|
342.5
|
345.9
|
349.4
|
344.2
|
| EPS - Reported - Basic |
0.12
|
0.16
|
0.17
|
0.19
|
0.64
|
0 14
|
0.10
|
0.13
|
0.16
|
0.53
|
0.15
|
0.15
|
0.17
|
0.21
|
0.68
|
| EPS - Reported - FD |
0.11
|
0.15
|
0.16
|
0.18
|
0.60
|
0.14
|
0.10
|
0.12
|
0.15
|
0.51
|
0.14
|
0.14
|
0.16
|
0.19
|
0.63
|
| EPS - Normalized - Basic |
0.12
|
0.15
|
0.16
|
0.19
|
0.62
|
0.15
|
0.13
|
0.14
|
0.17
|
0.59
|
0.16
|
0.16
|
0.18
|
0.22
|
0.72
|
| EPS - Normalized - FD |
0.11
|
0.14
|
0.15
|
0.18
|
0.58
|
0.14
|
0.13
|
0.13
|
0.16
|
0.56
|
0.15
|
0.15
|
0.17
|
0.21
|
0.68
|
| % Change |
175%
|
133%
|
88%
|
38%
|
87%
|
27%
|
-7%
|
-13%
|
-11%
|
-3%
|
7%
|
15%
|
31%
|
37%
|
21%
|
E = Morgan Stanley Equiry Research estimates.
MS 00917
| Exhibits |
| PeopleSoft - Financial Statistics and Ratios |
| |
2001 |
2002E |
2003E |
| |
3/01
|
6/01
|
9/01
|
12/01
|
CV01
|
3/02
|
6/02E
|
9/02E
|
12/02E
|
CY02E
|
3/03E
|
6/03E
|
9/03E
|
12/03E
|
CYME
|
| Growth Y/Y% |
| License Fees |
6.99
|
51.4
|
15.4
|
5.8
|
30.1
|
-13.0
|
-27.8
|
-15.7
|
-13.3
|
-17.5
|
2.0
|
10.0
|
14.0
|
16.0
|
10.7
|
| Services |
22.3
|
20.2
|
21.5
|
11.9
|
18.8
|
3.7
|
-2.0
|
0.0
|
2.3
|
1.0
|
6.6
|
9.6
|
11.6
|
12.7
|
10.2
|
| Total revenues |
34.1
|
26.8
|
15.1
|
6.4
|
19.6
|
-6.0
|
-15.2
|
-9.2
|
-6.2
|
-9.2
|
3.6
|
9.7
|
12.2
|
13.7
|
9.9
|
| Cost of Licenses |
55.9
|
132.9
|
41.7
|
21.8
|
57.6
|
-29.7
|
-44.1
|
-9.5
|
-13.3
|
-26.0
|
-4.9
|
3.5
|
7.3
|
9.2
|
3.9
|
| Sales & Marketing |
45.8
|
17.3
|
8.1
|
-1.8
|
14.7
|
-1.3
|
-9.3
|
-4.7
|
-4.1
|
-4.9
|
0.5
|
5.5
|
7.4
|
10.4
|
6.0
|
| Product Development |
-1.1
|
-12 4
|
-7.5
|
-5.6
|
-6.7
|
4.2
|
18.9
|
24.7
|
24.5
|
17.8
|
15.6
|
6.9
|
9.2
|
8.6
|
10. 0
|
| General & Administrative |
32.2
|
75.0
|
40.5
|
32.4
|
43.9
|
-10.7
|
-28.0
|
-26.7
|
-20.7
|
-22.1
|
2.5
|
6.7
|
10.0
|
9.7
|
7.2
|
| Total expenses |
24.5
|
11.9
|
-7.6
|
2.6
|
6.6
|
.04
|
0.3
|
1.7
|
3.7
|
1.5
|
6.4
|
3.5
|
8.3
|
9.6
|
6.9
|
| Operating Profit |
440.2
|
252.7
|
165.8
|
51.3
|
143.2
|
37.4
|
-11.0
|
-14.4
|
-8.1
|
-2.2
|
5.8
|
35.5
|
35.9
|
34.4
|
27.6
|
| % of Sales |
| License margin |
89.4
|
89.0
|
92.1
|
91.5
|
90.5
|
91.4
|
91.5
|
91.5
|
91.5
|
91.5
|
9.20
|
92.0
|
92.0
|
92.0
|
92.0
|
| Services margin |
44.0
|
13.9
|
47.7
|
47.3
|
45.7
|
52.0
|
52.0
|
52.2
|
52.2
|
52.1
|
53.0
|
53. 0
|
53.0
|
53.0
|
53.0
|
| Sales & Marketing |
24.5
|
24.1
|
24.2
|
24.1
|
24.3
|
25.8
|
25.8
|
25.4
|
24.7
|
25.4
|
25.0
|
24.8
|
24.3
|
24.0
|
24.5
|
| Product Development |
15.4
|
13.6
|
13.6
|
13.9
|
14.1
|
17.0
|
19.0
|
18.7
|
18.5
|
18.3
|
19.0
|
18.5
|
18.2
|
17.7
|
18.3
|
| General & Administrative |
6.6
|
7.7
|
7.9
|
7.2
|
7.3
|
6.3
|
6.5
|
6.3
|
6.1
|
6.3
|
6.2
|
6.3
|
6.2
|
5.9
|
6.1
|
| Total expenses |
46.5
|
45.2
|
45.8
|
45.3
|
45.7
|
49.7
|
53.5
|
51.3
|
50.1
|
51.1
|
51.0
|
50.4
|
49.5
|
48.3
|
49.7
|
| Operating Margin |
9.0
|
10.5
|
13.2
|
14.9
|
11.9
|
13.1
|
11.0
|
12.4
|
14.6
|
12.8
|
13.4
|
13.5
|
15.0
|
17.3
|
14.9
|
| Pretax Margin |
10.7
|
12.9
|
14.5
|
13.7
|
13.7
|
14.6
|
12.6
|
14.0
|
16.2
|
14.4
|
15.0
|
15.2
|
16.6
|
18.7
|
16.5
|
| Net Margin |
7.0
|
8.4
|
9.5
|
10.7
|
8.9
|
9.6
|
9.0
|
9.4
|
10.9
|
9.7
|
10.1
|
10.2
|
11.1
|
12.5
|
11.0
|
| Selected Ratios and Balance Sheet Highlights |
| Book Value/Shr |
3.45
|
4.13
|
4.44
|
4.93
|
-
|
5.26
|
-
|
-
|
-
|
-
|
-
|
-
|
-
|
-
|
-
|
| Cash/shr |
3.35
|
3.96
|
4.41
|
5.05
|
-
|
5.46
|
-
|
-
|
-
|
-
|
-
|
-
|
-
|
-
|
-
|
| Sales/Shr |
6.04
|
6.33
|
6.47
|
6.56
|
-
|
6.41
|
-
|
-
|
-
|
-
|
-
|
-
|
-
|
-
|
-
|
| Total Cash Investments |
1155
|
1402
|
1515
|
1673
|
-
|
1823
|
-
|
-
|
-
|
-
|
-
|
-
|
-
|
-
|
-
|
| Total Debt |
57
|
57
|
57
|
57
|
-
|
57
|
-
|
-
|
-
|
-
|
-
|
-
|
-
|
-
|
-
|
| Total Equity |
1087
|
1315
|
1430
|
1592
|
-
|
1716
|
-
|
-
|
-
|
-
|
-
|
-
|
-
|
-
|
-
|
| Total Assets |
2024
|
2285
|
2363
|
2548
|
-
|
2667
|
-
|
-
|
-
|
-
|
-
|
-
|
-
|
-
|
-
|
| Total Receivables |
430
|
402
|
354
|
375
|
-
|
313
|
-
|
-
|
-
|
-
|
-
|
-
|
-
|
-
|
-
|
| Rec Days Outsi |
75
|
66
|
61
|
63
|
-
|
58
|
-
|
-
|
-
|
-
|
-
|
-
|
-
|
-
|
-
|
| Employees |
8255
|
8539
|
8631
|
6436
|
-
|
6512
|
-
|
-
|
-
|
-
|
-
|
-
|
-
|
-
|
-
|
| Revenue Per Employee |
0.23
|
0.24
|
0.24
|
0.25
|
-
|
0.25
|
-
|
-
|
-
|
-
|
-
|
-
|
-
|
-
|
-
|
| Average Contract Size |
0.500
|
0.600
|
0.700
|
0.700
|
-
|
0.600
|
-
|
-
|
-
|
-
|
-
|
-
|
-
|
-
|
-
|
| Number of Customers |
4119
|
4249
|
4352
|
4499
|
-
|
4577
|
-
|
-
|
-
|
-
|
-
|
-
|
-
|
-
|
-
|
| New customers |
130
|
120
|
103
|
147
|
-
|
78
|
-
|
-
|
-
|
-
|
-
|
-
|
-
|
-
|
-
|
| Deferred revenue |
415
|
419
|
408
|
409
|
-
|
421
|
-
|
-
|
-
|
-
|
-
|
-
|
-
|
-
|
-
|
| Deferred Rev/LTM Rev |
22%
|
21%
|
20%
|
19%
|
-
|
20%
|
-
|
-
|
-
|
-
|
-
|
-
|
-
|
-
|
-
|
| Provision for Doubtful Accounts |
9.4
|
4.9
|
1.5
|
0.8
|
-
|
-
|
-
|
-
|
-
|
-
|
-
|
-
|
-
|
-
|
-
|
| Depreciation and Amortization |
19.7
|
23.5
|
30.6
|
29.3
|
-
|
-
|
-
|
-
|
-
|
-
|
-
|
-
|
-
|
-
|
-
|
| LTM Sales |
1903
|
2018
|
2087
|
2119
|
-
|
2088
|
2006
|
1958
|
1924
|
-
|
1942
|
1987
|
2045
|
2114
|
-
|
| LTM EPM |
0.38
|
0.46
|
0.53
|
0.58
|
-
|
0.61
|
0.60
|
0.58
|
0.56
|
-
|
0.57
|
0.59
|
0.63
|
0.68
|
-
|
E = Morgan Stanley' Equity Research estimates
MS 00918
The information and opinions in this report were prepared by Morgan Stanley & Co. Incorporated ("Morgan Stanley"). Morgan Stanley has no obligation to tell you when opinions or information in this report change. Morgan Stanley and its affiliate companies are involved in many businesses that may relate to companies mentioned in this report. These businesses include market making and specialized trading, risk arbitrage and other proprietary trading, fund management, investment services and investment banking.
This report is based on public information. Morgan Stanley makes every effort to use reliable, comprehensive information, but we make no representation that it is accurate or complete. We are not offering to buy or sell the securities mentioned or soliciting an offer to buy or sell them
Within the last three years, Morgan Stanley, Morgan Stanley DW Inc. and/or their affiliate companies managed or co-managed a public offering of the securities of Agile Software, Ariba, Aspect Communications, Click Commerce, E.piphany, informatica, Manugisrics Group Inc., McAfee.com, SilverStream Software, Ventas Software, Vignette, i2 Technologies and webMethods.
Morgan Stanley, Morgan Stanley DW Inc. and/or their affiliate companies make a market in the securities of Agile Software, Ariba, Aspect Communications, BEA Systems, Business Objects, Check Point Software, Click Commerce, Cognos Inc, Compuware, Documentum, Hyperion Solutions, Informatica, J.D. Edwards, KANA Software, Manugistics Group Inc., Mercury Interactive, Novell, Oracle, PeopleSoft, Peregrine Systems, Quest Software Inc, Rational Software Corp., SeeBeyond, Siebel Systems, SilverStream Software, T1BC0 Software, TeleTech, Veritas Software, Vignette and webMethods
Morgan Stanley, Morgan Stanley DW Inc., affiliate companies, and/ or their employees may have an investment in securities and derivatives of securities of companies mentioned in this report. These derivatives may be issued by Morgan Stanley or others associated with it. The securities discussed in this report may not be suitable for all investors. Investors must make their own investment decisions based on their own investment objectives and financial position. Morgan Stanley recommends that investors independently evaluate each issuer, security or instrument discussed, and use any independent advisers they believe necessary. The value of and income from your investment may vary because of changes in interest rales or foreign exchange rates, changes in the price of securities or other indexes in the securities markets, changes in operational or financial conditions of companies and other factors. There may be time limitations on the exercise of options or other rights in your securities transactions. Past performance is not necessarily a guide to future performance.
This publication is disseminated in Japan by Morgan Stanley Japan Limited and/or Morgan Stanley Nippon Securities Limited; in Singapore by Morgan Stanley Dean Witter Asia (Singapore) Pte., regulated by the Monetary Authority of Singapore; in Australia by Morgan Stanley Dean Winer Australia Limited A.B.N. 67 003 734 576, a licensed dealer, which accepts responsibility for its contents; in certain provinces of Canada by Morgan Stanley Canada Limited, which has approved of, and has agreed to take responsibility for, the contents of this publication in Canada; in Spain by Morgan Stanley, S.V., S.A., a Morgan Stanley group company, which is supervised by the Spanish Securities Markets Commission (CNMV) and states that this document has been written and distributed in accordance with the rules of conduct applicable to financial research as established under Spanish regulations, in the United States by Morgan Stanley & Co. Incorporated and Morgan Stanley DW Inc. which accept responsibility for its contents; and in the United Kingdom, this publication is approved by Morgan Stanley & Co. International Limited, solely for the purposes of section 21 of the Financial Services and Markets Act 2000. Private U.K. investors should obtain the advice of their Morgan Stanley & Co. International Limited representative about the investments concerned.
This report may not be sold or redistributed without the written consent of Morgan Stanley Dean Witter & Co. Morgan Stanley is a service mark of Morgan Stanley Dean Witter & Co.
Additional information on recommended securities is available on request.
MS 00919
|
The Americas
1585 Broadway
New York, NY 10036-8293
United States
Tel: +1 (1)212 761 4000
|
Europe
25 Cabot Square, Canary Wharf
London EI4 4QA
United Kingdom
Tel:+44 (0)20 7513 8000 |
Japan
20-3, Ebisu 4-chome
Shibuya-ku,
Tokyo 150-6008,
Tel: +81 (0)3 5424 5000 |
Asia/Pacific
Three Exchange Square
Central
Japan Hong Kong
Tel: +852 2848 5200 |
| INDUSTRY COVERAGE: ENTERPRISE SOFTWARE |
| Company |
Ticker |
Rating as of |
Price at 4/24/02 |
|
Company |
Ticker |
Rating as of |
Price at 4/24/02 |
| Agile Software |
AGIL.O |
E 3/18/02 |
$9.01
|
|
Mercury Interactive |
MERQ.O |
O 3/18/02 |
$36.51
|
| Ariba |
ARBA.O |
E 3/18/02 |
$3.48
|
|
Network Associates |
NET.N |
NR 3/18/02 |
$23.75
|
| Aspect Communications |
ASPT.O |
E 3/18/02 |
$4.79
|
|
Novell |
NOVL.O |
U 3/18/02 |
$3.70
|
| BEA Systems |
BEAS.O |
E 3/18/02 |
$10.42
|
|
Oracle |
ORCL.O |
O 3/18/02 |
$10.50
|
| BMC Software |
BMC.N |
E 3/18/02 |
$14.64
|
|
PeopleSoft |
PSFT.O |
E 4/2/02 |
$22.48
|
| Business Objects |
BOBJ.O |
E 3/18/02 |
$35.11
|
|
Peregrine Systems |
PRGN.O |
O 3/18/02 |
$8.31
|
| Check Point Software |
CHKP.O |
E 3/18/02 |
$18.25
|
|
Quest Software Inc |
QSFT.O |
E 3/18/02 |
$12.70
|
| Click Commerce |
CKCM.O |
E 3/18//02 |
$1.05
|
|
Rational Software Corp |
. RATL.O |
E 4/19/02 |
$14.10
|
| Cognos Inc |
COGN.O |
O 3/18/02 |
$24.51
|
|
SAP |
SAP.N |
O 3/18/02 |
$33.35
|
| Computer Associates |
CA.N |
O 3/18/02 |
$18.44
|
|
SeeBeyond |
SBYN.O |
E 4/23/02 |
$3.22
|
| Compuware |
CPWR.O |
U 3/22/02 |
$8.08
|
|
Siebel Systems |
SEBL.O |
E 3/18/02 |
$23.76
|
| Documentum |
DCTM.O |
E 3/18/02 |
$19.29
|
|
SilverStream Software |
SSSW.O |
U 3/18/02 |
$4.90
|
| E.piphany |
EPNY.O |
E 3/18/02 |
$5.65
|
|
TeleTech |
TTEC.O |
O 3/18/02 |
$12.27
|
| Hyperion Solutions |
HYSL.O |
E 3/18/02 |
$24.46
|
|
TIBCO Software |
TIBX.O |
£ 3/18/02 |
$9.05
|
| \2 Technologies |
ITWO.O |
E 3/18/02 |
$3.28
|
|
Veritas Software |
VRTS.O |
O 3/18/02 |
$26.85
|
| Informatica |
INFA.O |
O 3/18/02 |
$8.50
|
|
Vignette |
VIGN.O |
U 3/18/02 |
$3.02
|
| J.D Edwards |
JDEC.O |
E 3/18/02 |
$11.99
|
|
webMethods |
WEBM.O |
E 3/18/02 |
$14.27
|
| KANA Software |
KANA.O |
E 3/18/02 |
$11.45
|
|
Stock ratings are subject tochange Please see |
| Manugistics Group Inc. |
MANU.O |
O 3/18/02 |
$16.21
|
|
|
|
|
|
| McAfee.com |
MCAF.O |
NR 3/18/02 |
$18.54
|
|
|
|
|
|
| ANALYST STOCK RATINGS |
|
Overweight (O). The stock's total return is expected to exceed the average total return of the analyst's industry (or industry team's) coverage universe, on a risk-adjusted basis, over the next 12-18 months.
Equal-weight (E). The stock's total return is expected to be in line with the average total return of the analyst's industry (or industry team's) coverage universe, on a risk-adjusted basis, over the next 12-!8 months
Underweight (U). The stock's total return is expected to be below the average total return of the analyst's industry (or industry team's) coverage universe, on a risk-adjusted basis, over the next 12-18 months.
More volatile (V). We estimate that this stock has more than a 25% chance of a price move (up or down) of more than 25% in a month, based on a quantitative assessment of historical data, or in the analyst's view, it is likely to become materially more volatile over the next l-!2 months compared with the past three years. Stocks with less than one year of trading history are automatically rated as more volatile (unless otherwise noted). We note that securities that we do not currently consider "more volatile" can still perform in that manner.
|
| ANALYST INDUSTRY VIEWS |
|
Attractive (A). The analyst expects the performance of his or her industry coverage universe to be attractive vs. the relevant broad market benchmark over the next 12-18 months
In-Line (I). The analyst expects the performance of his or her industry coverage universe to be in line with the relevant broad market benchmark over the next 12-18 months.
Cautious (C) The analyst views the performance of his or her industry coverage universe with caution vs. the relevant broad market benchmark over the next 12-18 months.
|
MS 00920
|
